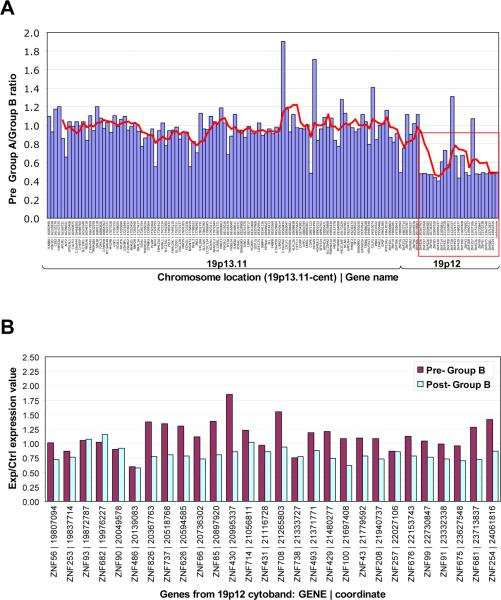
Figure 3. KRAB-ZNF gene expression on chromosome 19p12-13.1 before and after IM therapy.
A: Analysis of pre-treatment ratios of tumors showing >25% (Group A) or <25 reduction (Group B) using data from 28 patients for all genes in the 19p12-13.1 locus. All genes, in this locus (red box) showed higher mean ZNF expression levels in Group B samples (i.e. lower Group A/Group B ratio) while adjoining genes showed roughly equal expression between the two groups. B: Analysis of changes in expression of genes in this locus upon IM treatment in Group B samples with >70% tumor cellularity. Red bars represent means of pre-treatment samples from Group B and blue bars represent means of post-treatment samples from Group B.

