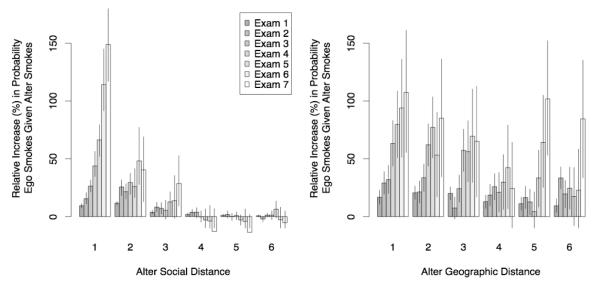
Figure 2. Effect of Social and Geographic Distance from Social Contacts Who Smoke on the Probability that a Subject is a Smoker in the Framingham Heart Study Social Network.
(a) Mean effect of social proximity to a contact. This is derived by comparing the conditional probability of being a smoker in the observed network with an identical network (with topology preserved) in which the same number of persons who smoke are randomly distributed. Contact social distance refers to closest social distance between the contact (“alter”) and the subject (“ego”) (a direct contact = distance 1, contact’s contact = distance 2, etc.). Within any given social distance, the effect of the smoking behavior in a social contact upon subject’s smoking behavior increases across the exams from 1971 to 2003. (b) This figure shows the effects observed between directly connected persons (social distance 1) for six groups, ordered by distance between residences. The average distances in each group are as follows: group 1 = 0 miles, group 2 = 0.27 miles, group 3 = 1.46 miles, group 4 = 3.48 miles, group 5 = 9.37 miles, and group 6 = 471.9 miles. Error bars in both panels show 95% confidence intervals based on 1,000 simulations. Both panels exclude neighbor and co-worker ties.

