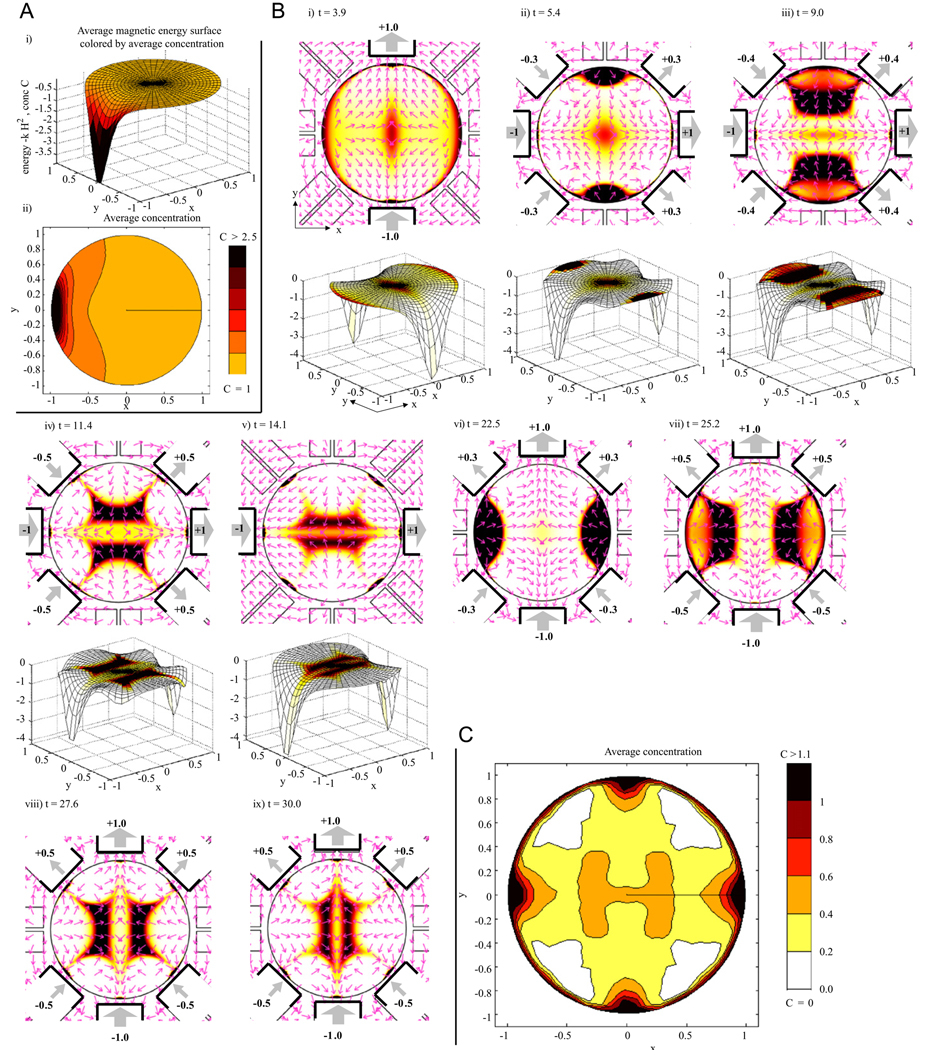
Fig. 4.
(A) Constant actuation: ferrofluid transport due to turning on the 5th (far left) magnet. (i) The magnetic energy surface U = −kH2 is plotted along the z-axis to show ferrofluid flowing downhill along the force directions F = −∇U with the resulting averaged concentration shown by the coloring here and in sub-panel (ii). (B) Dynamic control: magnets are now turned on and off to transport ferrofluid to the center. The first 5 sub-panels show ferrofluid concentration and magnetic actuation with the corresponding magnetic energy surfaces. Energy surfaces for the last 4 panels (not shown) are 90° flips of the ones shown (see the main text). Coloring denotes concentration (scale bar same as in C). On magnets are illustrated by heavy black lines with weighted thick gray arrows and numbering showing magnet strength and orientation (South to North outwards is a positive polarity). Thin pink arrows (normalized to unit length) show magnetic force directions which match the gradients of the magnetic energy surfaces (forces point down the surfaces). (C) The resulting time-averaged ferrofluid concentration. Note the on-average hot spot at the center target.

