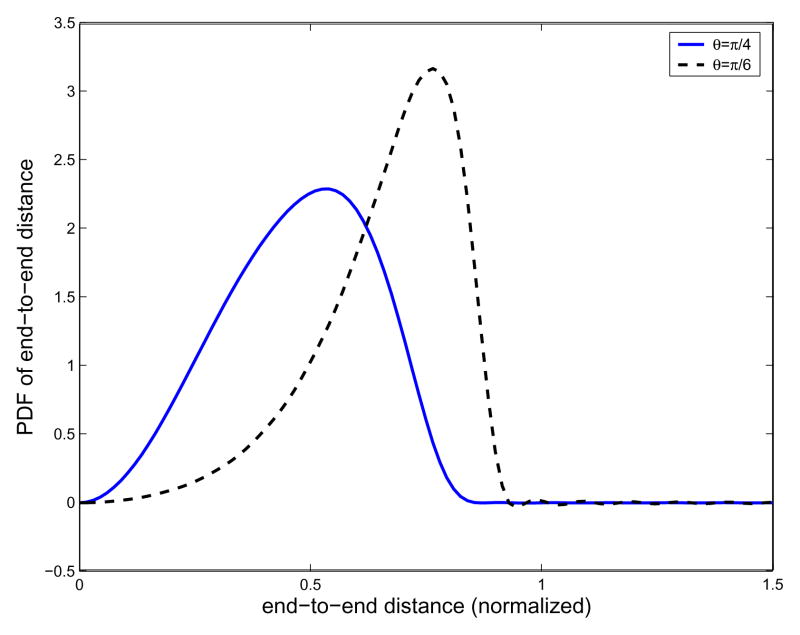
Fig. 4.
Plot of the resulting end-to-end distance probability density functions for the freely-rotating model. The number of links is set to be 20. θ denotes the bond angle of the polymer chain. The continuous line corresponds to the case when θ= π/4, and the dotted line to the case when θ = π/6. In the simulations, the band width of the Fourier transform for SE(3) and upper limit of integration with respect to frequency factor p are denoted as Nb and Lp, respectively, and Nb = 12 and Lp = 50 are used in the case of θ = π/4, and Nb = 16 and Lp = 60 are used in the case of θ = π/6.

