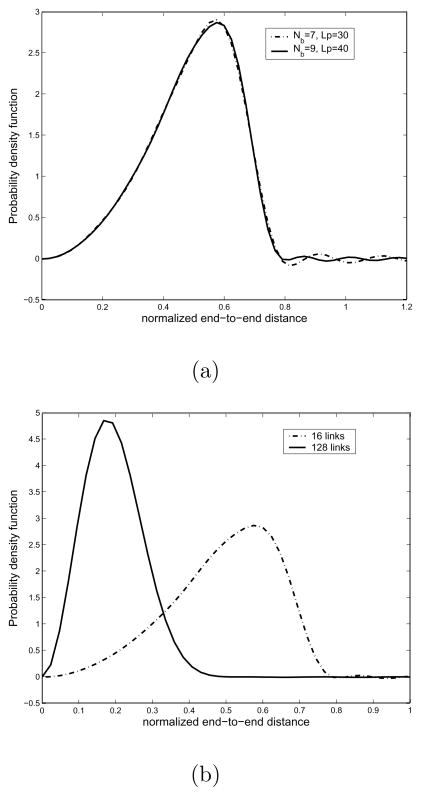
Fig. 6.
Plot of the resulting end-to-end distance probability density functions for the independent energy model. All the monomer chains are assumed to be identical, with β0 = 75.1°. (a) The plot of PDFs with different Nb and Lp. It shows that as Nb and Lp get larger, one can describe the corresponding PDF better. (b) The plot of PDFs with different number of links. From this figure, one can see that the PDF for chains with a large number of links gets more concentrated on the left side.

