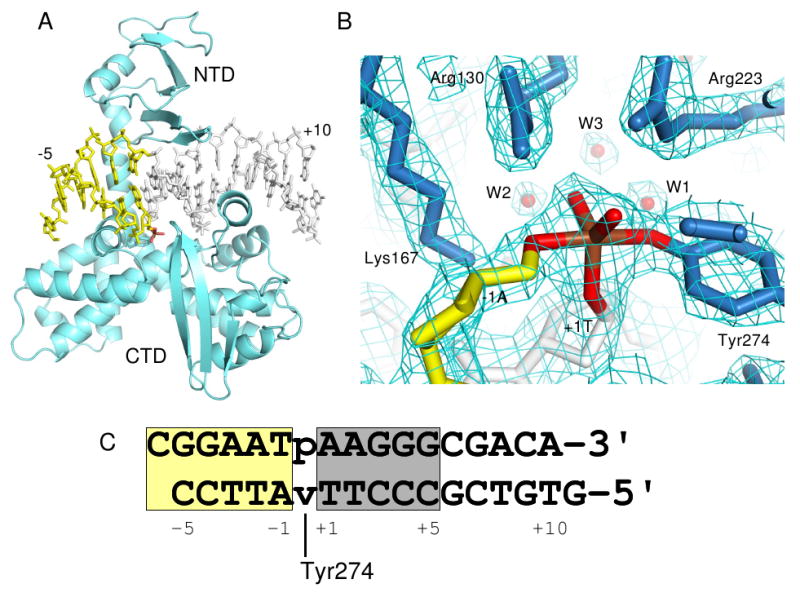
Figure 1.

Variola virus TopIB-DNA-vandate complex. (A) Overall structure of the complex. NTD=N-terminal domain; CTD=C-terminal domain. (B) Electron density within the active site following refinement. The density is from a σA-weighted 2Fo-Fc map contoured at 1.2σ. (C) Sequence of the DNA duplex used to form the vTopIB-DNA-vanadate complex with the core recognition/activation sequence shaded gray. The vanadate linkage is indicated by ‘v’, with covalent attachment of Tyr274 indicated. The numbering indicated is used throughout the text. In all panels, DNA downstream of the cleavage site is colored yellow and the vanadium linkage is highlighted in brown and red. Figures 1a,b, 2a, 3, 5, & 6 were produced using Pymol (Delano, 2002).
