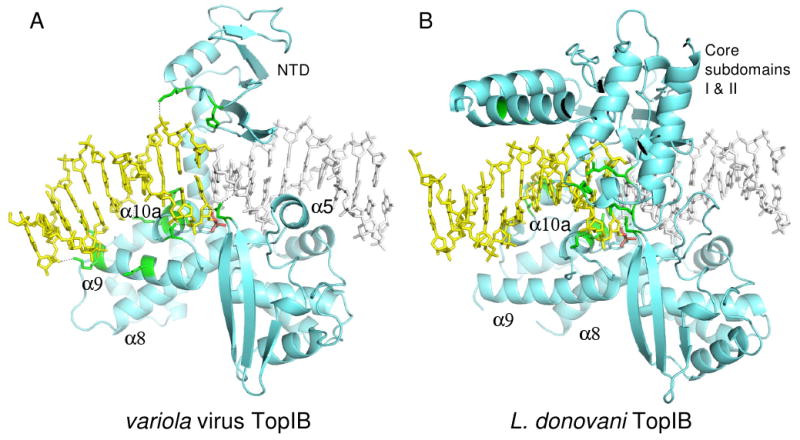
Figure 3.

Comparison of (A) variola virus TopIB and (B) L. donovani TopIB (PDB code 2B9S) transition state mimic complexes. The view orientations of the two complexes are identical with respect to the conserved active site residues. Protein regions that contact DNA downstream of the cleavage site are colored green. In (A), the DNA is bent by 35-40°, resulting in a trajectory that facilitates interaction with the N-terminus of α9. Note the different orientations of the α9 helix in the two complexes. The downstream DNA in panels A and B is colored yellow and in panel A the downstream DNA includes part of an adjacent duplex related by crystallographic symmetry (see Figure S1).
