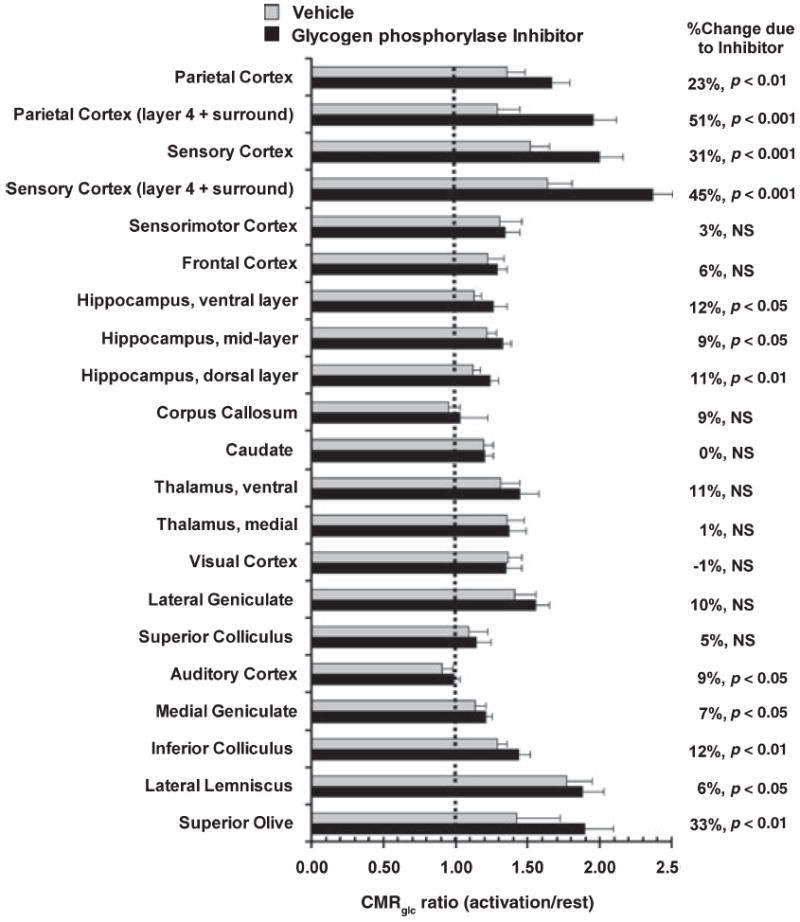
Fig. 4.

Differential activation of CMRglc in functional pathways during glycogenolysis blockade. The relative change in CMRglc during stimulation compared with rest in the same treatment group (vehicle- and CP-316,819-treated) was calculated from data shown in Fig. 3 by dividing each value for stimulated rats by the respective mean value for resting CMRglc for that structure in that group. Values are mean ratios (bars = 1 SD); ratios > 1.0 indicate activation due to sensory stimulation. Statistically significant differences between ratios for each structure in CP-316,819- compared with vehicle-treated rats were identified with the t-test after logarithic transformation of the ratio data (Zar 1974).
