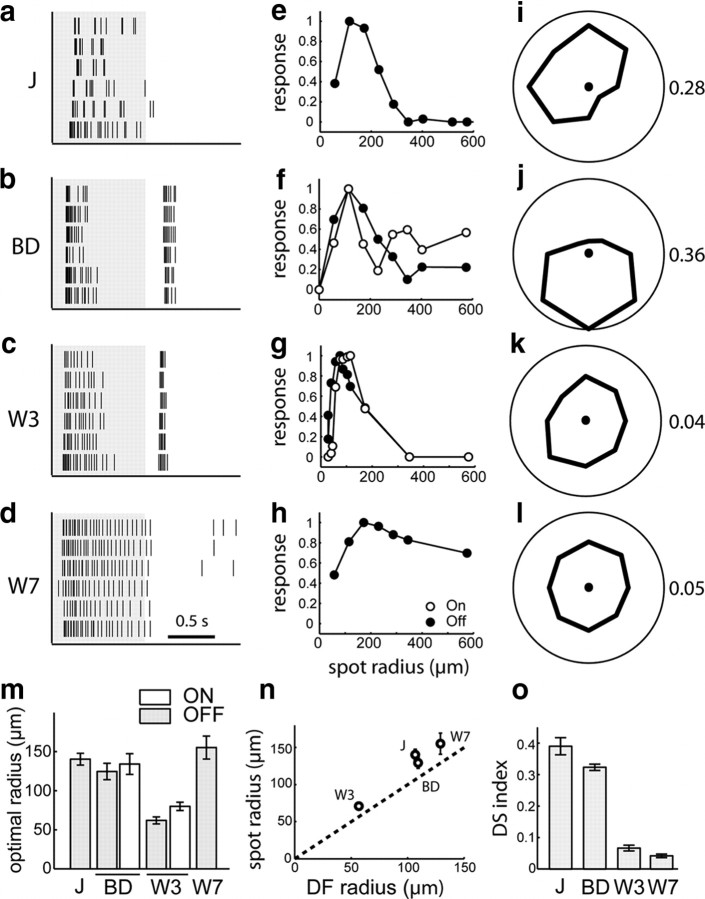
Figure 4.
Visual response properties of J-, BD-, W3-, and W7- RGCs. a–d, Sample responses to a spot flashing on (white) and off (gray) over the receptive field center. Raster plot of spikes on six repeats. e–h, Responses to flashing spots as a function of the spot radius. Plotted is the number of spikes during the light off (closed circles) or light on (open circles) period normalized to the maximum. i–l, Responses to small spots moving across the receptive field center in different directions. The polar plot shows the relative number of spikes fired for each of the eight directions. The corresponding direction selectivity index (DS index) values are indicated on the right. m, The optimal spot radius, a measure of the receptive field center size, for each of the RGC types. Error bars denote SEM. Sample size is 17, 6, 23, and 15 for J, BD, W3, and W7, respectively. n, The radius of the dendritic field plotted against the radius of the optimal spot for each of the four types. Ordinate shows the radius of a circle with the same area as the dendritic field. o, Direction selectivity (DS) index for each of the RGC types, calculated as described in Materials and Methods. Sample size is 16, 10, 11, and 4 for J, BD, W3, and W7, respectively. All error bars indicate SEM.

