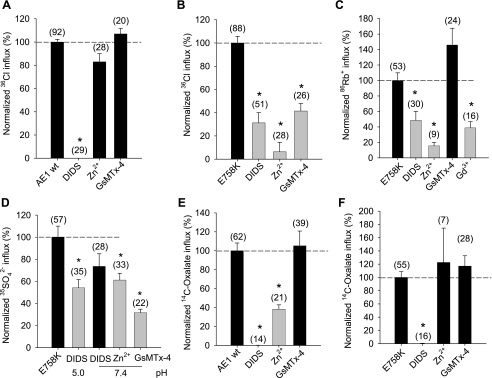
Fig. 9.
Pharmacological profiles of AE1 E758K-associated ion transport in Xenopus oocytes. Effects of the indicated inhibitors on normalized values of (A) 36Cl− into Xenopus oocytes expressing wild-type AE1; (B) 36Cl− influx into oocytes expressing AE1 E758K; (C) 86R+ influx into oocytes expressing E758K; (D) SO42− influx into oocytes expressing E758K at the indicated bath pH values; (E) 14C-oxalate influx at pH 5.5 into oocytes expressing wild-type AE1; or (F) 14C oxalate influx at pH 5.5 into oocytes expressing E758K. H2O-corrected values are means ± SE for (n) oocytes, and normalized to mean uptake in the absence of inhibitors. Inhibitor concentrations were DIDS (200 μM), Zn2+ (200 μM), GsMTx-4 (1 μM), Gd3+ (50 μM). *and gray bar indicate P < 0.05 compared to absence of inhibitor (Dunnett's t-test).

