Fig. 2.
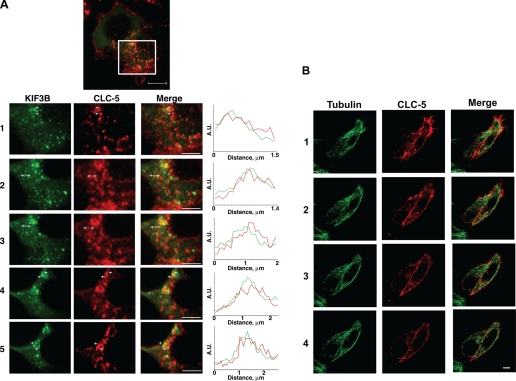
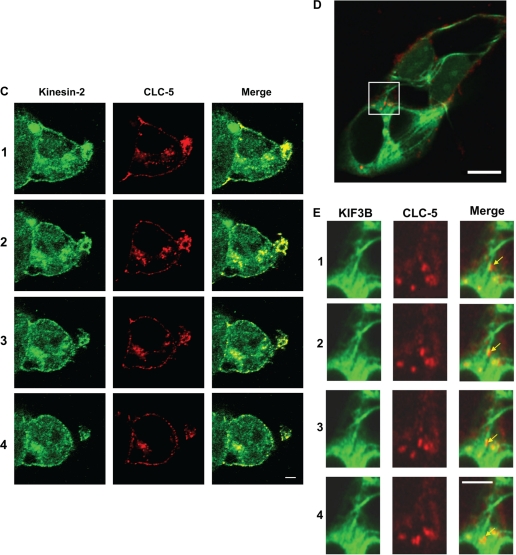
Confocal microscopy shows colocalization of CLC-5 and KIF3B. HEK293 cells transfected with fluorescently tagged CLC-5 and KIF3B (CLC-5-RFP and KIF3B-GFP) and costained with anti-α-tubulin or anti-Kinesin-2. A-C: Z-stack dual wavelength confocal microscopy. For each stack, images were obtained in 2 channels over 15 horizontal planes that were 0.7 μm apart. A: HEK293 cells transfected with KIF3B-GFP and CLC-5-RFP. Green signals: KIF3B; red signals: CLC-5; yellow signals: colocalized KIF3B and CLC-5 (merge). Confocal Z-stack images and intensity profile line scans demonstrated that KIF3B-GFP and CLC-5-RFP are partially colocalized, as evidenced by the yellow signals or by an overlap of <300 nm, which is the estimated diameter of a proximal tubular endosomal vesicle (19), in the red and green peaks (confocal images 1 to 5). The intensity profile line scans were performed between the white crosses as indicated on confocal images 1 to 5, with the intensity measured in arbitrary units (A.U.). Scale bar top: 10 μm; scale bar confocal images 1 to 5: 2 μm. B: HEK293 cells transfected with CLC-5-RFP and costained with anti-α-tubulin. Red signals: CLC-5; green signals: tubulin; yellow signals: colocalized CLC-5 and tubulin (merge). CLC-5-RFP was present at the plasma membrane and in punctate structures throughout the cytoplasm, where it was localized with tubulin, indicating its association with microtubules. Scale bars: 10 μm. C: HEK293 cells transfected with CLC-5-RFP and costained with anti-Kinesin-2 antibody. Red signals: CLC-5; green signals: Kinesin-2; yellow signals: colocalized CLC-5 and Kinesin-2 (merge). Scale bars: 10 μm. D and E: live cell imaging using dual-wavelength confocal microscopy of HEK293 cells cotransfected with full-length CLC-5-RFP and full-length KIF3B-GFP. Green signals: KIF3B; red signals: CLC-5; yellow signals: colocalized CLC-5 and KIF3B. Scale bar: 10 μm. A proportion of CLC-5-RFP-labeled vesicles was transported along KIF3B-labeled cytoskeletal network structures. E: progress of a vesicle (arrowed), over 10 s, is illustrated. The vesicles were estimated to move at an approximate rate of 0.42 μm/s. Scale bar: 5 μm.


