Fig. 5.
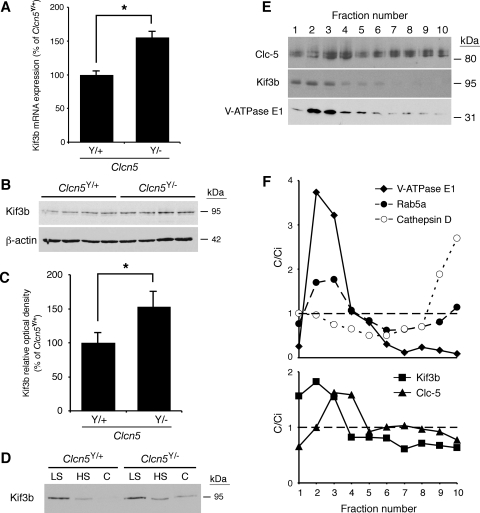
Expression level and subcellular distribution of Kif3b in Clcn5Y/+ and Clcn5Y/− mouse kidneys. A: quantitative PCR (qPCR) of mRNA in Clcn5Y/+ and Clcn5Y/− kidneys (n = 4 in each group). Kif3b mRNA levels (adjusted to GAPDH mRNA) are significantly higher in Clcn5Y/− than control kidneys (155 ± 11%; *P < 0.05). B: representative Western blot for Kif3b in Clcn5Y/+ and Clcn5Y/− kidneys (n = 4 in each group), using 20 μg of protein. C: densitometric analysis normalized to β-actin levels confirms that Kif3b protein is more abundant in Clcn5Y/− kidneys (153 ± 19% of Clcn5Y/+ level; *P < 0.05). D: representative Western blot for Kif3b in low-speed (LS), high-speed (HS) membrane, and cytosolic (C) fractions of Clcn5Y/+ and Clcn5Y/− kidneys. The samples were loaded at 20 μg total protein per lane, as appropriate for subcellular fractionations (13). Kif3b is detected in the cytosol of Clcn5Y/− samples but not in controls. E and F: density distribution after centrifugation of the HS (membrane) fraction, using a Percoll gradient, is presented compared with the initial concentration (C/Ci), so that values >1 reflect organelle enrichment and values <1 reflect organelle depletion. This gradient resolves a low-density peak (fractions 2–4), including early endosomes (Rab5a, V-ATPase), from a high-density peak (fractions 9–10), enriched in lysosomes (cathepsin D). Kif3b partially overlaps with V-ATPase E1 subunit (low-density fractions 2–3) and Clc-5 (fraction 3), which supports their association with endosomes (F). Means ± 1 SE and P values were calculated by the Student's unpaired, 2-tailed t-test.

