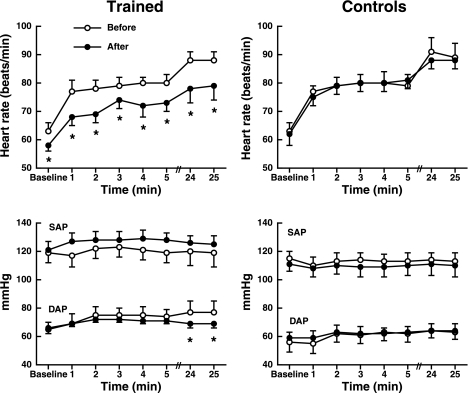
Fig. 1.
Heart rate (top) and arterial blood pressure (bottom) differences before and after 8 wk in both trained and control groups during head-up tilt. Heart rate increases significantly from baseline during head-up tilt in both groups. However, heart rate responses were attenuated after training. Values are means ± SE. *Significantly different from before. SAP, systolic arterial pressure; DAP, diastolic arterial pressure.

