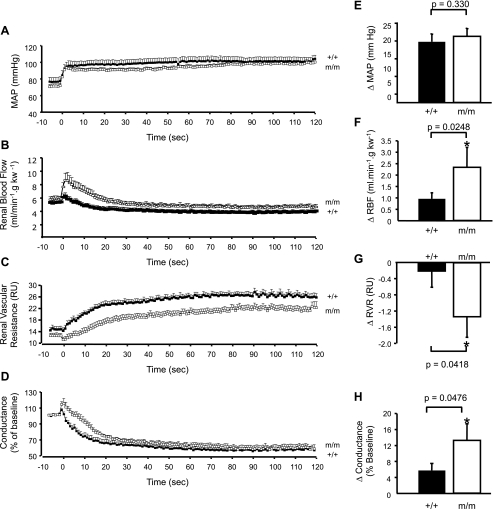
Fig. 2.
Time course of renal blood flow (RBF) correction. Time course of the autoregulatory response of mean arterial pressure (MAP; A), RBF (B), renal vascular resistance (RVR; C), and conductance as % of baseline (D) to a step increase in renal arterial pressure (RAP) in +/+ (■, n = 9) and mutant (m/m; □, n = 7). Peak change in RAP (E), RBF (F), RVR (G), and conductance as % of baseline (H) following step increase in MAP are shown. P values for analysis with t-test are provided for E–H. Data are means ± SE. *Significantly different from +/+ control animals, P < 0.05.

