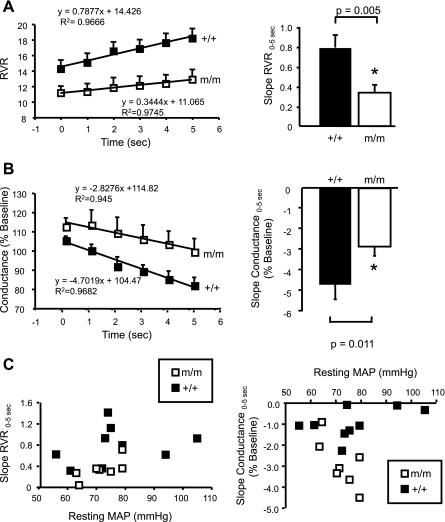
Fig. 3.
Contribution of the myogenic response to RBF autoregulation following a step increase in MAP. The slope of the linear regression RVR (A) and conductance (B) from time 0–5 s was used to determine the speed of myogenic RBF autoregulation in +/+ (■, n = 9) and m/m (□, n = 7). Group data are shown at right. C: scatter plots of baseline MAP vs. slope RVR0–5s and MAP vs. slope conductance0–5s. This graph demonstrates that the reduced RVR0–5s and conductance0–5s slope is not a function of baseline MAP. Data are means ± SE. *Significantly different from +/+ control animals, P < 0.05.

