Figure 6.

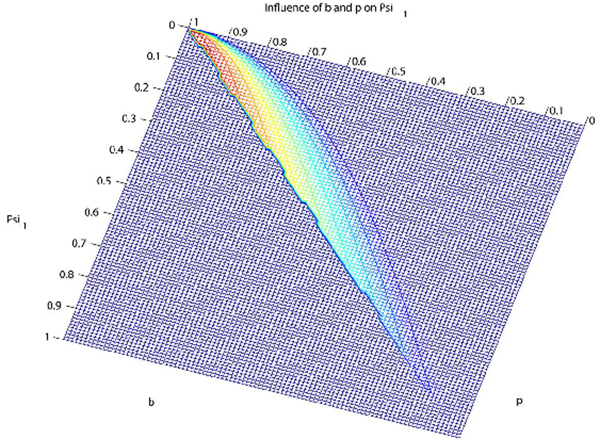
Contour plot illustrating the influence of parameters b and p on Ψ1, based on Griffiths-Pakes process with linear-fractional distribution. Red: large Ψ1; blue: small Ψ1. Range of Ψ1-values, from 0 through 1.

Contour plot illustrating the influence of parameters b and p on Ψ1, based on Griffiths-Pakes process with linear-fractional distribution. Red: large Ψ1; blue: small Ψ1. Range of Ψ1-values, from 0 through 1.