
Figure 6.
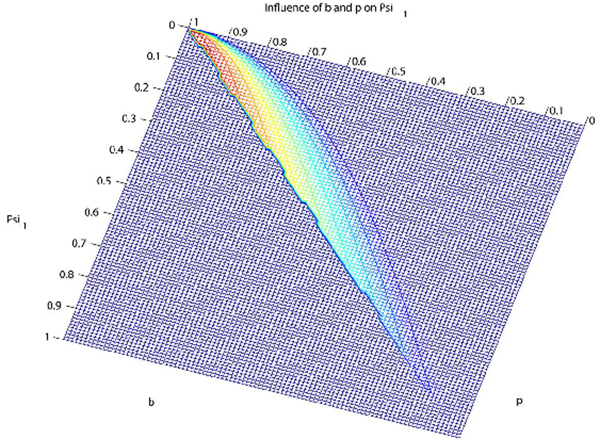
Contour plot illustrating the influence of parameters b and p on Ψ1, based on Griffiths-Pakes process with linear-fractional distribution. Red: large Ψ1; blue: small Ψ1. Range of Ψ1-values, from 0 through 1.
Official websites use .gov
A
.gov website belongs to an official
government organization in the United States.
Secure .gov websites use HTTPS
A lock (
) or https:// means you've safely
connected to the .gov website. Share sensitive
information only on official, secure websites.
Contour plot illustrating the influence of parameters b and p on Ψ1, based on Griffiths-Pakes process with linear-fractional distribution. Red: large Ψ1; blue: small Ψ1. Range of Ψ1-values, from 0 through 1.