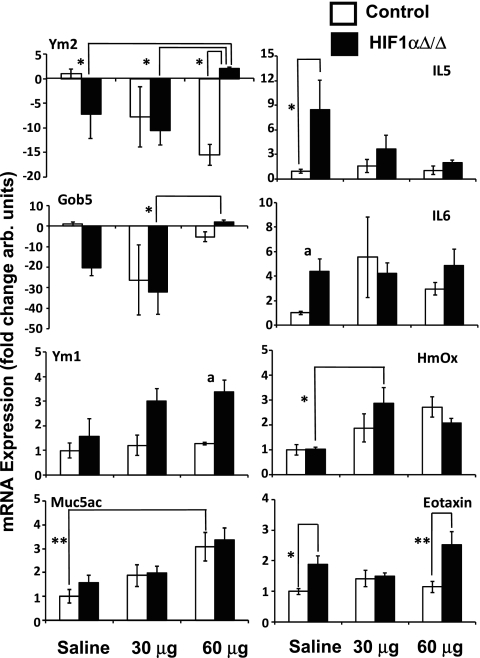
Fig. 7.
Gene expression results. The expression of 63 genes was analyzed by qRT-PCR. Those genes that showed a difference as pooled samples were further analyzed as independent replicates. Expression levels were normalized to the saline-treated control animal and expressed as fold change. aP < 0.07, *P < 0.05, **P < 0.01.

