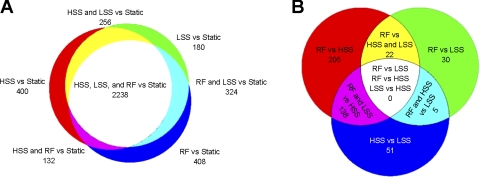
Fig. 3.
Venn diagrams providing insight into the mechanisms regulating differential gene expression. A: differentially expressed genes in a comparison of high shear stress (HSS), low shear stress (LSS), or RF to static conditions. Approximately 57% of the differentially expressed genes are found in the central white area of the diagram, indicating that these genes were differentially expressed by all three flow conditions compared with static conditions. B: differentially expressed genes in a comparison of the three flow conditions to each other. The 138 genes found in the magenta region of the diagram are regulated by LSS. The 22 genes found in the yellow region of the diagram are regulated by RF. The five genes found in the blue-green region of the diagram are regulated by HSS.

