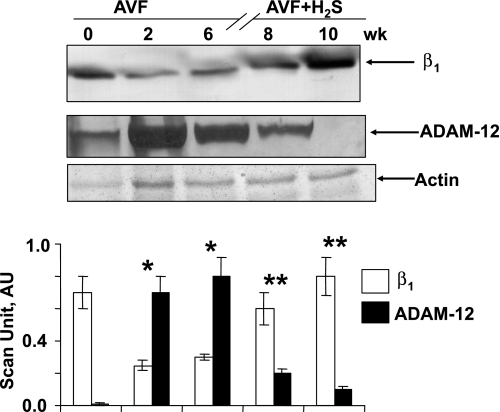
Fig. 4.
Western blot of β1-integrin (β1) and a disintegrin and metalloproteinase-12 (ADAM-12) at 0, 2, and 6 wk after AVF and 8 and 10 wk after AVF treated with NaHS (H2S donor). Corresponding actin bands are shown. Bar graphs represent the scan AU normalized with actin. Each bar is an average ± SD from n = 6 in each group. *P < 0.001 compared with 0 wk. **P < 0.001 compared with 6 wk.

