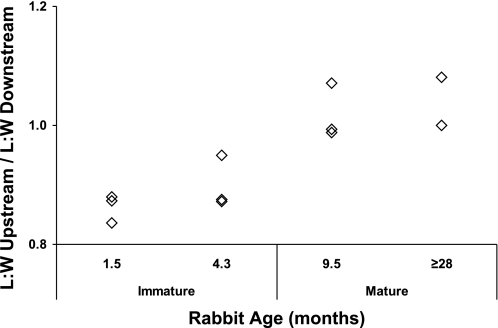
Fig. 6.
Changes with age in the pattern of endothelial nuclear length-to-width ratios (L/W) upstream and downstream of rabbit aortic branches. The upstream L/W has been divided by the downstream L/W, so values <1 indicate greater nuclear elongation downstream, and values >1 indicate greater elongation upstream. Each point indicates the data for a single rabbit (24 branches in total, 5–8 in each age group). Ages are the mean for each group.

