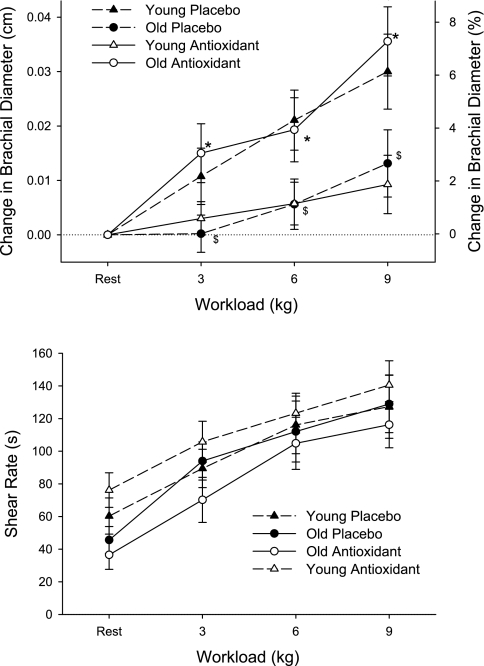
Fig. 2.
Change in brachial artery diameter (top) and shear rates (bottom) in young and old subjects at rest and at 3 levels of handgrip exercise either after the ingestion of the AO cocktail or placebo. Values for %change in brachial diameter (top) are not exact and are displayed solely for reference purposes. Shear rate in the brachial artery was calculated for young and old under each of these conditions (bottom). Values are means ± SE. $P < 0.05, diameter changes in old PL trial significantly decreased from those in young PL trial. *P < 0.05, diameter changes during AO trial significantly increased from PL in old subjects. Note young subject data (dashed lines) are presented for reference purposes only (31).

