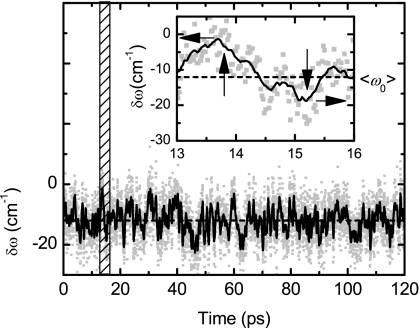
Figure 11.
Simulated frequency fluctuation of the asymmetric stretch mode. Inset shows a zoom of the marked area. Grey dots and solid black lines represent the frequency fluctuation and its window average, respectively. Dash black line is the average of the frequency fluctuation ⟨ω0⟩ with respect to the gas phase value at 0 cm−1.

