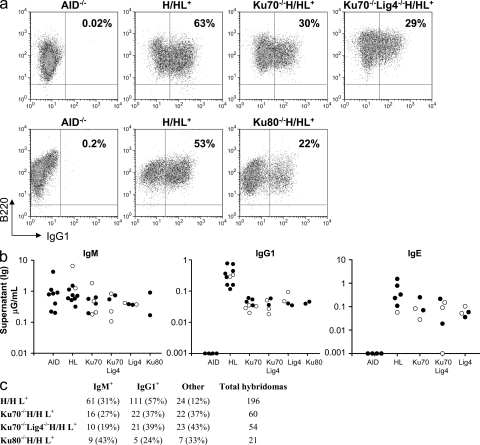
Figure 2.
High IgG1 and IgE CSR levels in Ku70−/−, Ku70−/−Lig4−/−, Ku80−/−, and Lig4−/− B cells. (a) Representative FACS panel for IgG1 CSR in B cells stimulated with αCD40 plus IL-4 and assayed at day 3.5. Data shown are representative of >10 experiments, with one or more mouse of each genotype per experiment. Table S1 contains a summary of all FACS experiments. (b) ELISA quantification of IgM, IgG1, and IgE secretion (μG/ml) in B cells stimulated as in a. Black circles, H/H (the knock-in prerearranged heavy chain receptor is present on both alleles); white circles, H/+ (knock-in heavy chain on one allele). All experiments completed are shown, with one mouse per genotype per experiment and each circle represents one mouse. Table S2 contains a detailed summary of all ELISA experiments. (c) Frequency of IgG1-secreting hybridomas generated from αCD40/IL-4–stimulated B cells. Hybridomas for one mouse per genotype are shown. The number and percentage of hybridomas is indicated for each isotype assayed. “Other” denotes hybridomas negative for both IgM and IgG1 secretion, some of which may be IgE+ because IgE ELISA was not performed for the fusions shown. Data shown are representative of three independent hybridoma fusion experiments (one mouse each) for WT-HL and Ku70−/−HL and two independent hybridoma fusions (one mouse each) for the Ku70−/−Lig4−/−HL mice. Table S3 contains a summary of all hybridoma data, with multiple mice of each genotype.

