Figure 1.
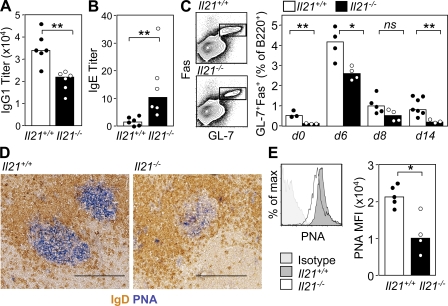
IL-21–deficient mice form detectable GCs after immunization, but the kinetics of the GC is altered. (A and B) ELISA analysis of total serum IgG1 (A) and IgE (B) in unimmunized mice of the indicated genotypes. (C) Flow cytometric contour plots and graphical analysis of GL-7+Fas+ GC cells gated on live B220+ lymphocytes from Il21+/+ and Il21−/− mice at the indicated time points after SRBC immunization. Each symbol represents one mouse. (D) Photomicrographs of spleen sections stained for IgD (brown) and PNA (blue) from Il21+/+ and Il21−/− mice 8 d after immunization. Data are representative of two independent experiments (n ≥ 4 per group). Bars, 200 µm. (E) Flow cytometric histograms and graphical analysis of PNA binding on GL-7+Fas+B220+ GC B cells from Il21+/+ and Il21−/− mice 7 d after SRBC immunization. Statistically significant differences are indicated (*, P ≤ 0.05; **, P ≤ 0.01). Data are representative of two independent experiments, each symbol represents one mouse, and tops of bars are drawn through the median values. MFI, mean fluorescence intensity; ns, not significant.

