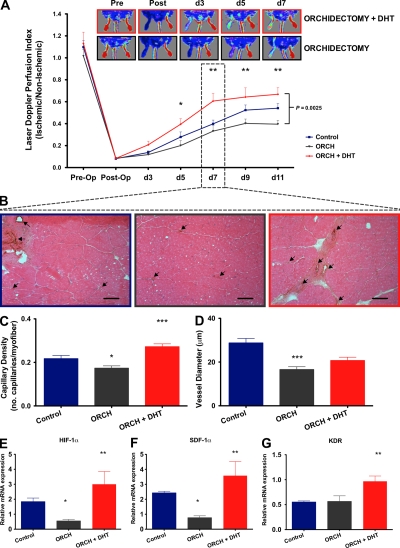
Figure 5.
Endogenous androgens modulate ischemia-induced angiogenesis. (A) LDPI. Limb perfusion ratio (ischemic/nonischemic) is presented with representative images (n = 8/group; combined data from four independent experiments are shown). Differences between groups were assessed by two-way ANOVA with Bonferroni correction (brackets at right). *, P < 0.05; and **, P < 0.01 for comparisons between orchidectomized and orchidectomized + DHT mice at individual time points. (B) Representative images of neovascularization of ischemic hindlimbs at day 7. Capillary density was measured in 8-µm frozen sections of the adductor muscles via immunohistochemical staining for vWF (arrows). Bars, 100 µm. (C) Capillary density expressed as the number of capillaries per myofiber (eosin) and (D) mean vessel diameter (n = 6/group; combined data from three independent experiments are shown). (E–G) Mechanisms of androgenic modulation of angiogenesis in hindlimb ischemia at day 3. Quantitative RT-PCR for the expression of the angiogenesis- and ischemia-related genes (E) HIF-1α, (F) SDF-1α, and (G) KDR (n = 6/group; combined data from three independent experiments are shown). *, P < 0.05; **, P < 0.01; and ***, P < 0.001 versus control using ANOVA. All data are expressed as means ± SEM.

