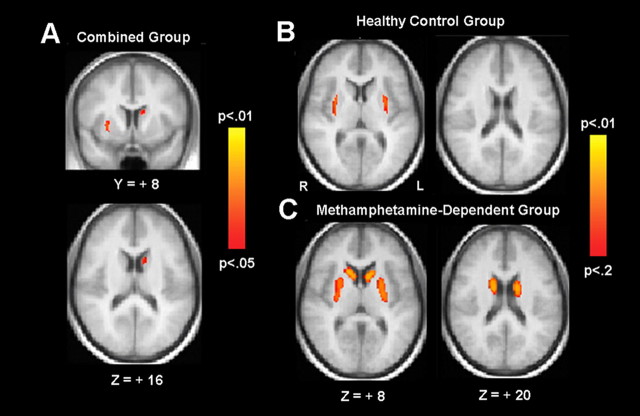
Figure 3.
Results from voxelwise regression of BPND on BIS total scores, shown for the combined (n = 52) (A), the healthy control (n = 30) (B), and the methamphetamine-dependent (n = 22) (C) groups. TFCE probability maps are overlaid on the averaged normalized anatomy. Statistical maps for the combined group are shown with results thresholded at TFCE-corrected p < 0.05. Data for the individual group are shown at a more liberal threshold (p < 0.2, corrected) for illustration only.

