
Figure 1.
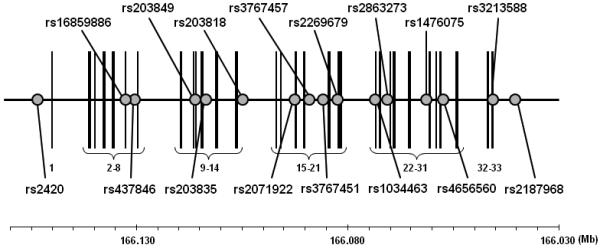
Structure of ADCY10 and location of the genotyped SNPs (NCBI Build 36.1). The circles indicate SNPs genotyped in this study. The vertical lines denote exons numbered from 1 to 33. The gene is depicted based on its orientation in the genome, and the chromosome location is shown in the baseline.