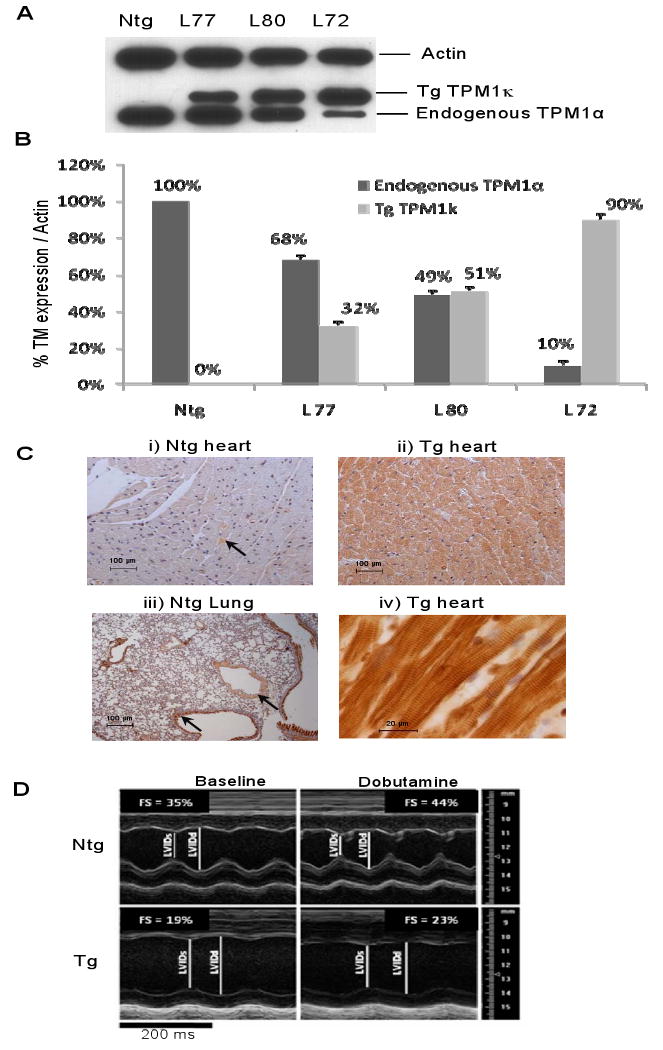
Figure 2.

Characterization of the TPM1κ Tg mice. A and B, Western blot analysis of myofilament preparations from TPM1κ Tg mouse hearts using striated muscle TM and actin antibodies. The TM level found in Ntg hearts was set to 100%, and the signal intensity of the TM isoforms in Tg mice were quantified and normalized to striated muscle α-actin. C, Immunohistochemistry of ventricular sections of Ntg and TPM1κ Tg hearts using anti-TPM1κ antibody. Arrows indicate the regions of expression for vascular smooth muscle TM in the Ntg tissue sections. Panel (iv) shows the incorporation of TPM1κ protein into sarcomeres as reflected by the striated staining pattern. D, Representative AM-mode echocardiographic images of adult left ventricular (LV) response to dobutamine. Short axis view AM-Mode recording of the LV from Ntg and Tg mice, before and after infusion of dobutamine. LVIDs = end systolic LV internal dimension; LVIDd = end-diastolic LV internal dimension; FS = fractional shortening.
