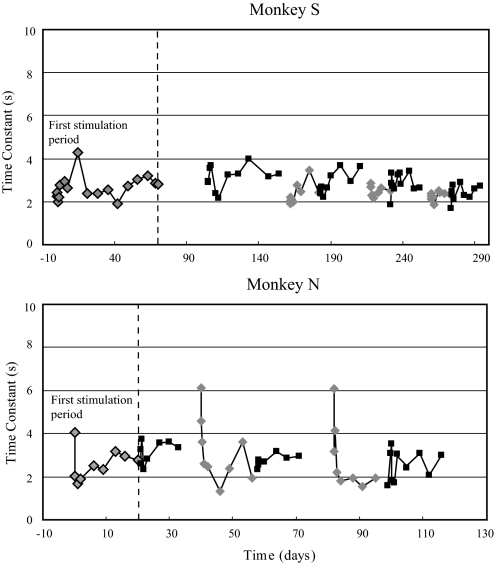
Fig. 6.
VOR time constants during the entire period of prosthetic stimulation, calculated from the transfer function fit to the VOR phase measured during sinusoidal rotation over a frequency range of 0.01 to 1.0 Hz. The first stimulation period is to the left of the vertical dashed line. Light diamonds are the low-sensitivity state of prosthetic stimulation and dark squares are the high-sensitivity state of prosthetic stimulation. Time constants could not be accurately calculated in the canal-plugged state with the prosthesis off because of the very low VOR gains.

