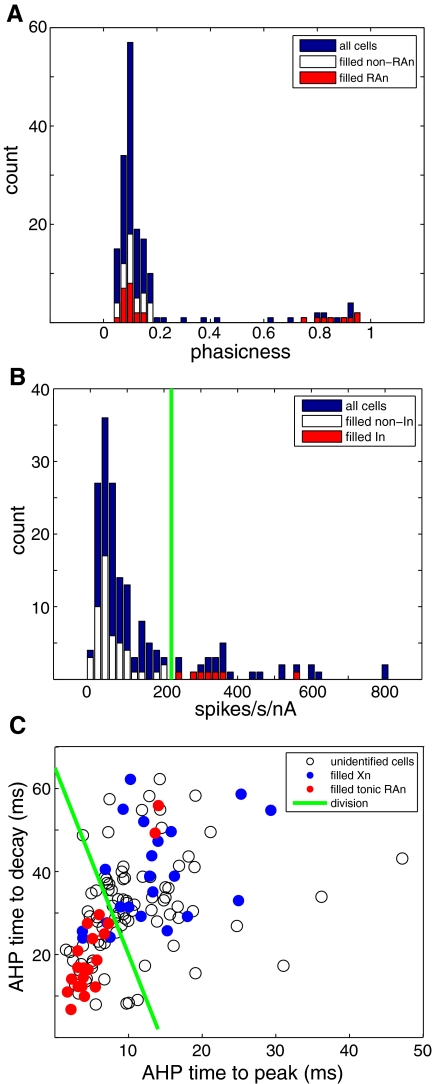
Fig. 2.
Distinguishing physiological characteristics of anatomically identified HVC cell types. A: identification of phasic HVC-RAn. A histogram for all cells of the phasicness of the suprathreshold response to somatic current injection (see methods) reveals 2 modes: one highly phasic and one tonic. All of the filled cells with axons in the phasic mode (>0.5) projected to RA. Note that a distinct population of filled RA-projecting neurons clustered near zero in the tonic mode. B: identification of putative HVC-In. A histogram of normalized firing rate for all cells shows that all of the filled interneurons had values >225 normalized spikes·s−1·nA−1, but all projection neurons had values <225 normalized spikes·s−1·nA−1. C: a scatterplot of HVC-Xn (basal ganglia Area X) and tonic HVC-RAn on 2 measures of afterhyperpolarization (AHP) timing: time to peak (AHPttp) and time to decay (AHPttd) (see methods), showing relative separation between the 2 cell classes. Filled points indicate cells that were verified to have axons projecting to Area X (blue) or to RA (red). The green line was used to conservatively identify a region containing most HVC-Xn, while excluding HVC-RAn (with 2 notable exceptions).

