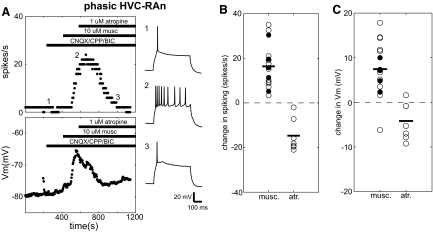
Fig. 3.
Phasic HVC-RAn are directly excited by muscarine. A: typical response of a phasic HVC-RAn to muscarine and atropine. Panels depict ongoing measurements of evoked spike rate (top left) and membrane potential (Vm, bottom left) taken regularly throughout the recording (see methods). Horizontal bars denote the times of drug application. As indicated, this experiment was performed in the presence of fast synaptic blockers. The right panels (1–3) show sample voltage sweeps in response to +0.13-nA current pulses before (1) and after (2) wash-in of 10 μM muscarine and after subsequent addition of 1 μM atropine (3). Numbers show how the traces correspond to the time points in the plots to the left. B: distribution of changes in spiking for phasic HVC-RAn in response to cholinergic agents. White and black circles denote recordings made, respectively, in the absence and presence of synaptic blockers. For muscarine experiments, changes in spike rate for each point are calculated as the difference between the predrug and postdrug values for that experiment (see methods). For atropine, the changes are also calculated as the difference between the predrug and postdrug values, relative to values measured in the presence of muscarine. Horizontal bars denote the population means. C: distribution of changes in Vm for phasic HVC-RAn in response to cholinergic agents. This panel is organized and the data were calculated as in B.

