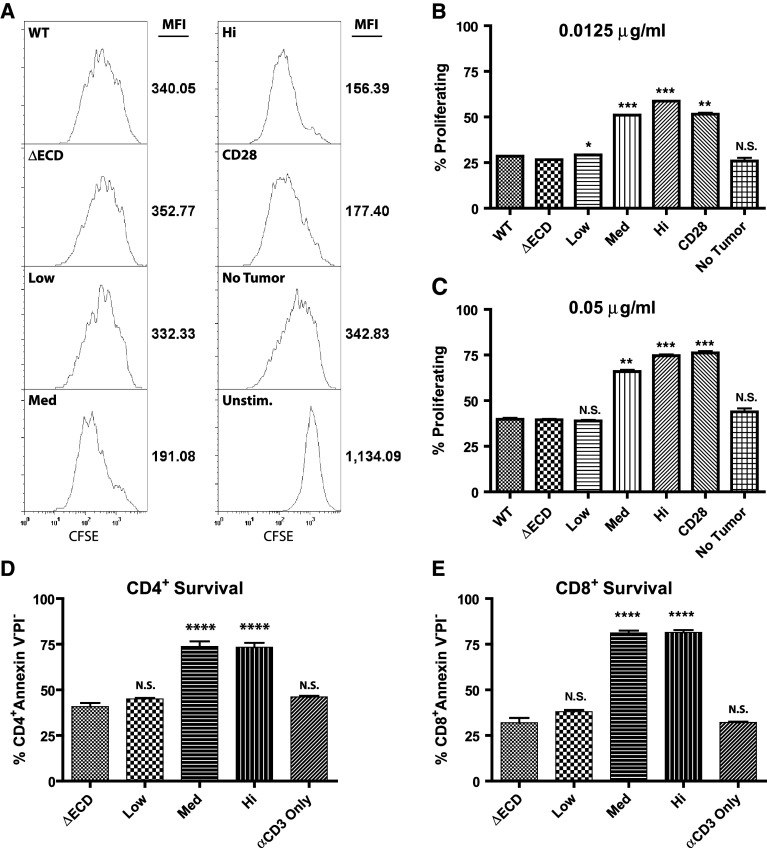
Fig. 2.
Costimulatory activity of CT26/GITR-L tumor cells. Proliferation assays were performed by stimulating naïve splenocytes labeled with CFSE with a sub-optimal concentration of anti-CD3 (0.0125 or 0.05 μg/ml) in the presence of gamma irradiated (100 Gy) tumor cells or 2 μg/ml anti-CD28. a CFSE labeled splenocytes stimulated with 0.0125 μg/ml anti-CD3 and the other indicated stimulants for 60 h were harvested and stained with anti-CD4. No tumor represents anti-CD3 alone and unstimulated represents proliferation in the absence of anti-CD3 stimulation. Histograms represent CFSE fluorescence intensity of CD4+ cells as analyzed by flow cytometry. CFSE mean fluorescence intensity is shown to the right of the graphs. b, c Graphs represent the percent of CD4+ cells that have undergone at least one round of cell division, as indicated by a decrease in CFSE fluorescence compared to unstimulated controls, when stimulated for 60 h with b 0.0125 μg/ml or c 0.05 μg/ml anti-CD3 and the other indicated stimulants. Anti-CD3 induced apoptosis of d CD4+ and (E) CD8+ apoptosis was measured by incubating gamma irradiated (100 Gy) tumor cells with naïve splenocytes and stimulating T cells with anti-CD3 (0.05 μg/ml) and the other indicated stimulants. After 60 h of incubation, cells were harvested and stained for CD4, CD8, propidium iodide, and annexin V and analyzed by flow cytometry. Data are representative of 3 experiments performed in duplicate. Statistics represent differences compared to ∆ECD. *P < 0.05, **P < 0.01, ***P < 0.001, ****P < 0.0001

