
Figure 2. Deuterium uptake of intact GCAP1 and myr-GCAP1 in their Ca2+-bound and Ca2+-free states.
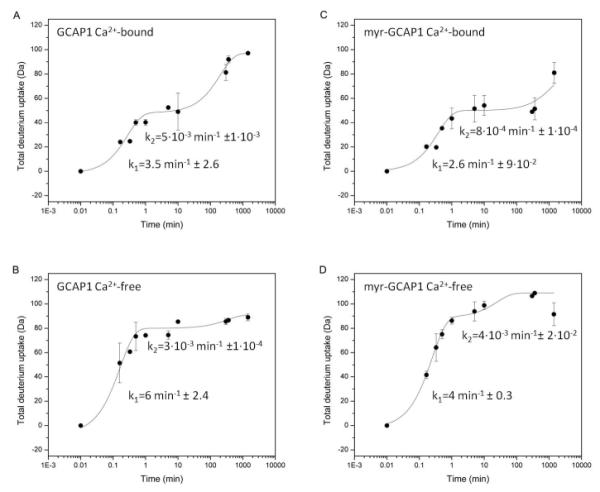
Panel A shows total deuterium uptake of intact GCAP1 at a high (25 mM) Ca2+ concentration (Ca2+-bound form) and panel B shows deuterium uptake of intact GCAP1 in the Ca2+-free state, i.e., 25 mM EDTA. Panels C and D show deuterium uptake of intact myr-GCAP1 in the Ca2+-bound and Ca2+-free states, respectively. Deuterium uptake experiments were performed as described in “Experimental procedures”. Error bars represent standard deviation between experimental repeats.