
Figure 4. Dynamics of the C-terminus region.
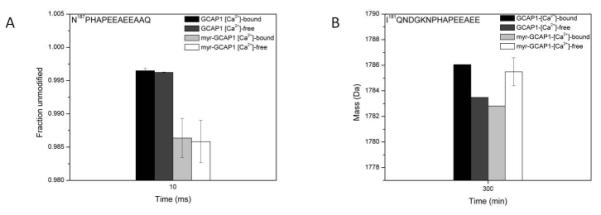
Panel A shows the unmodified fraction of the region 187NPHAPEEAEEAAQ whereas panel B indicates the deuterium uptake profile of the region 181IQNDGKNPHAPEEAEE. The experimental setup (i.e., Ca2+-free and Ca2+-bound states of GCAP1 and myr-GCAP1) was the same as described in Fig. 3.