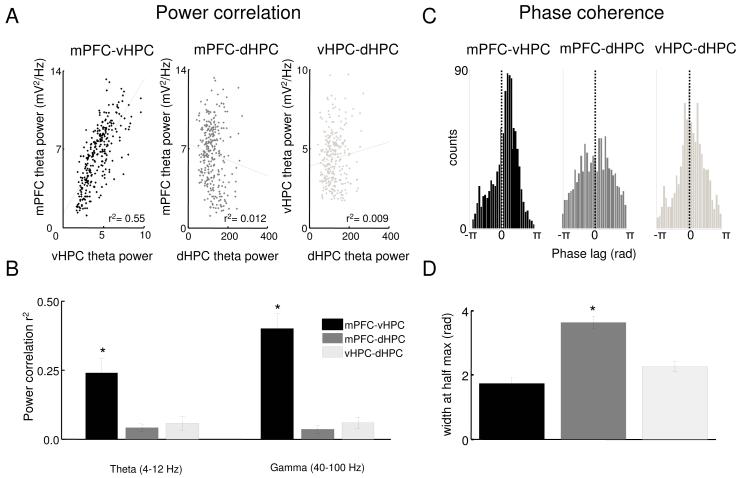
Figure 2. Power correlations and phase coherence across areas.
(A) Representative examples of theta power correlation scatter plots for vHPC-mPFC, dHPC-mPFC and vHPC-dHPC from a 10 minute recording session in the familiar arena. Each data point represents the sum of theta power during a 2.6 s window. (B) Averages of the linear correlation coefficients of theta (left corner) and gamma (right corner) power across 13 animals for vHPC-mPFC, dHPC-mPFC and vHPC-dHPC. Error bars are ± s.e.m. *p<0.01 for paired t-tests on the Fisher’s Z-transformed r values compared to mPFC-vHPC. (C) Representative histogram of theta phase differences. Instantaneous theta phase of two signals were subtracted from each other and the difference in theta phase was plotted as a histogram, for mPFC-vHPC (black), mPFC-dHPC (dark grey) and dHPC-vHPC (light grey). Narrower peaks in the histogram indicate a more consistent phase relationship. (D) Width of theta phase difference histogram at half of the peak height averaged across 13 animals for vHPC-mPFC (right panel), dHPC-mPFC (center panel) and vHPC-dHPC (left panel). Error bars are ± s.e.m. *p<0.01 for t-test comparing mPFC-vHPC to mPFC-dHPC.

