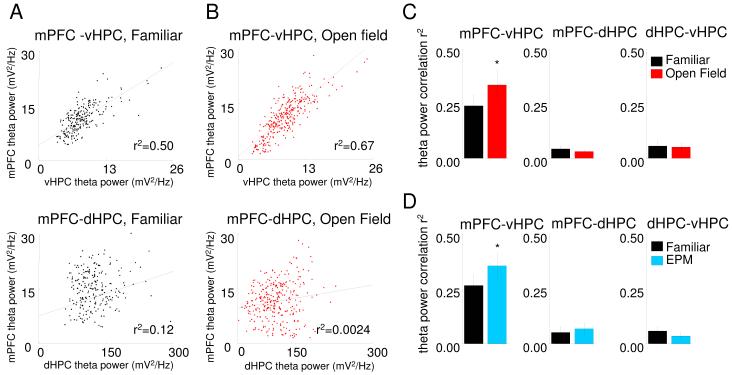
Figure 3. Theta power correlation between mPFC and vHPC increases in the EPM and open field.
(A) Representative example of theta power correlation plot in the familiar arena between mPFC and vHPC (upper panel) and dHPC (lower panel). (B) Theta power correlation plot in the open field from the same animal as in Fig. 4a between mPFC and vHPC (upper panel) and the dHPC (lower panel). Note the increase in mPFC-vHPC linear correlation r2 compared to Figure 4 A. Changes in averaged r2 of theta power correlations between in the familiar arena and open field (C) and EPM D) for mPFC-vHPC (left panel), mPFC-dHPC (middle panel) and dHPC-vHPC (right panel). Bars are averages of data from 13 animals, error bars are ± s.e.m. *p<0.05 for a paired t-test for the Fisher’s Z transformed r values. See also Figures S2, S3 and S4.

