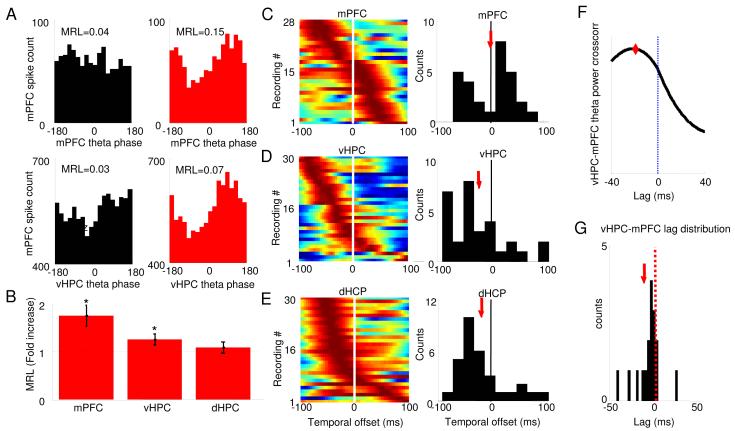
Figure 4. Multiunit phase-locking to mPFC and vHPC theta increases in the open field.
(A) Representative examples of the distribution of preferred phases of multiunit activity recorded in the mPFC relative to local (upper panels) and vHPC (lower panels) theta oscillations in the familiar arena (black histograms) and the open field (red histograms). (B) Mean +/− S.E.M. of MRL values in the open field relative to the familiar environment for multiunit recordings to mPFC (left bar), vHPC (middle) and dHPC (right) theta oscillations. Note that the MRL in the open field is larger than in the familiar arena, indicating more robust phase-locking to both mPFC and vHPC theta oscillations. (C-E). mPFC units phase lock best to local theta of the present (C) and hippocampal theta o f the past (D,E). Color-coded plots show changes in MRL values for multiunit recordings after spikes are shifted in time relative to theta oscillations of mPFC (C), vHPC (D) and dHPC (E). Higher MRL values correspond to warmer colors. Each row corresponds to one multiunit recording. Rows are arranged according to the temporal offsets that produce maximal phase locking. Upper rows correspond to multiunit recordings that phase lock most robustly with large negative shifts, i.e., maximal phase locking to theta of the past. Histograms showing the population distribution of the temporal offsets with highest phase locking are shown on the right. The population mean is indicated by red arrows. Note that on average spikes in the mPFC are most strongly phase locked to hippocampal theta of theta of the past. Only recordings that were significantly phase locked (by Rayleigh’s test for circular uniformity, Bonferroni corrected p< 0.05/40) in at least one temporal shift were used. n=28-30 multiunit recordings. *p<0.05 for a paired Wilcoxon’s signed rank test on MRL values. (F) Example of crosscorrelation of mPFC and vHPC theta power. Note that the crosscorrelation peaks at a negative lag, indicating that theta power changes occur first in the vHPC and then in the mPFC. Instantaneous power was calculated through the Hilbert transform. (G) Histogram showing the distribution of lags with maximal crosscorrelation across animals. The median lag is significantly different from zero (−8 ms, p<0.05, signrank test). Only segments of data where vHPC theta power was greater than the mean vHPC theta power for a given session were used. The population mean is indicated by a red arrow.

