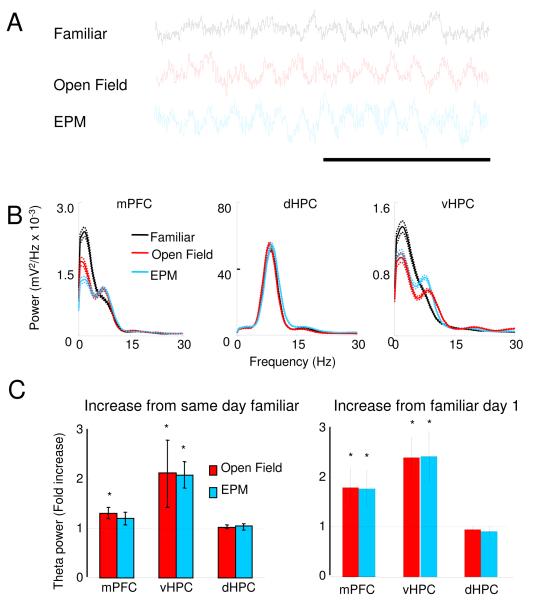
Figure 5. Theta power in the mPFC and dHPC increases during exposure to the EPM and open field.
(A) Representative traces of mPFC LFPs recorded from the same animal in the familiar arena, open field and EPM. Calibration: 1s. (B) Examples of representative power spectra in the familiar arena (black traces), open field (red) and EPM (blue) from LFPs of the mPFC (left panel), vHPC (center) and dHPC (right). Mean power was calculated using the Welch method with s.e.m. (dashed lines) calculated across windows. (C) Left panel: Fold increases in theta power relative to the familiar arena exposures obtained in the same day as the open field (red bars) and in the EPM (blue bars) recordings. Right panel: Same as left panel, but relative to the first day of exposure to the familiar environment. All data are taken from epochs in which animals were running consistently in the 7-15 cm/s speed range. See also Figures S5 and S9.

