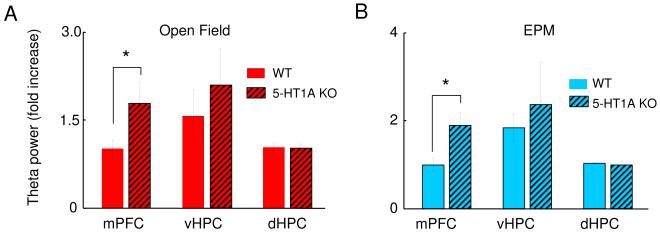
Figure 9. 5-HT1A knockouts (5-HT1A KO) have a higher increase in mPFC theta power in the EPM and the open field relative to wildtype (WT) mice.
Bar graphs of average fold theta increase in the mPFC (left), vHPC (center) and dHPC (right), for the open field (red bars, upper panel) and EPM (blue bars, lower panel). Bars represent averages of 7 WT (clear bars) and 7 5-HT1A KO (thatched bars) mice. Error bars are ± s.e.m. *p<0.05 for a paired Wilcoxon’s signed rank test comparing the fold theta increases of WT and 5-HT1A KO animals. Fold theta power changes were calculated from epochs in which animals were running consistently in the 7-15 cm/s speed range.

