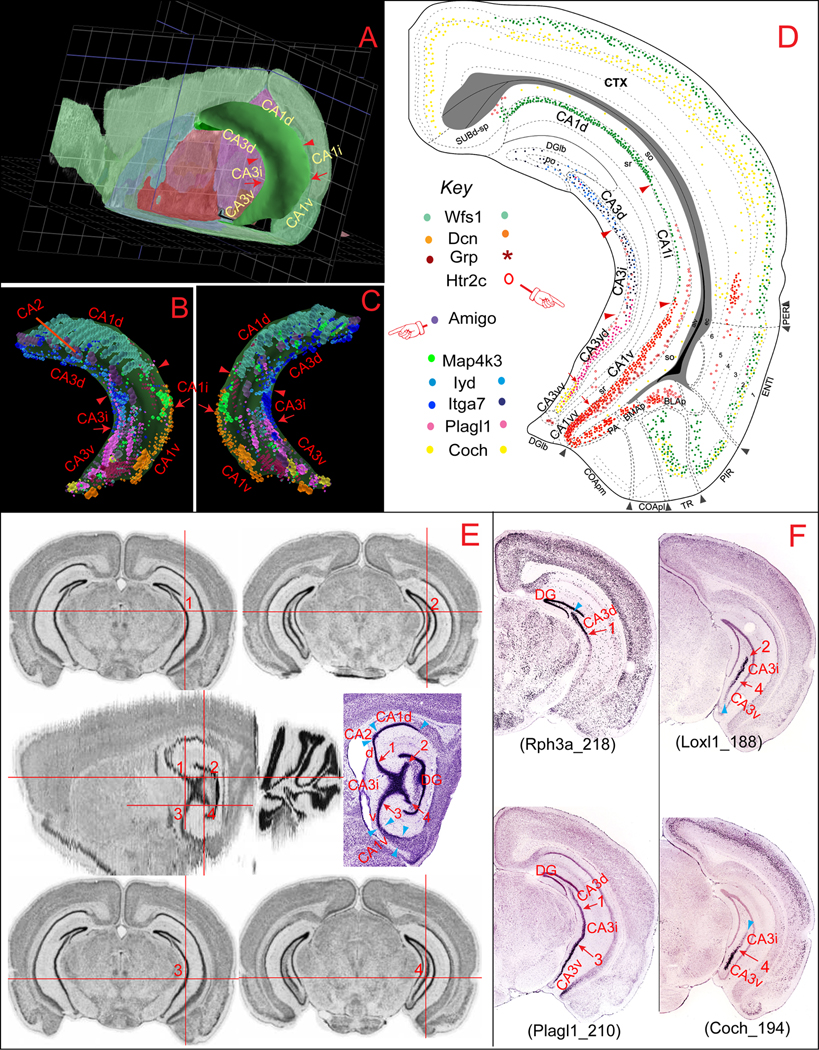
Fig. 1.
Molecular domains of the hippocampal CA1 and CA3. A shows a three dimensional (3D) model of Ammon's horn, which appears as a “C” shaped cylinder with its dorsal and ventral ends towards rostral and medial directions of brain. CA1 occupies the area dorsal, lateral, and caudal to the CA3. B (lateral view) and C (medial view) display heterogenic spatial distribution patterns of several representative marker genes expressed specifically in CA1 (Wfs1, Dcn, Grp, and Htr2c), CA2 (Amigo), or CA3 (Map4k3, Iyd, Itga7, Plagl1, and Coch). Expression of these genes in the Ammon’s horn reveals clear segregation between the dorsal (including CA1d, CA2, CA3d), intermediate (CA1i and CA3i), and ventral (CA1v and CA3v) areas. Expression of these genes were plotted onto representative coronal planes of the Allen Reference Atlas (Dong, 2007) as shown in D, which reveals clear boundaries between these molecular domains in CA1 and CA3. The 3D model and gene expression in Ammon’s horn were generated in BrainExplore (Lau et al, 2008), a 3D application of the Allen Reference Atlas (www.brain-map.org). E illustrates the spatial definition of the CA3i, which appears as an “X”-shaped pyramidal neuronal pool on one particular “re-sliced” sagittal plane of the Allen Reference Atlas (in the middle panel, ~2.494 mm from the middle line). The detailed Nissl-stained cytoarchitecture of the hippocampus is shown side by side. Numbers 1–4 indicate four corners of the “X” shaped pyramidal pool in domain CA3i at this sagittal plane and their corresponding spatial positions on the coronal planes (shown in the dorsal and ventral panels), which indicate the boundaries between the CA3d and CA3i (number 1; number 2 represents the dorsal end of the CA3 at the most caudal level) and between CA3i and CA3v (number 3 at more rostral and 4 more caudal). These images were generated with the AGEA application of the ABA. F shows four representative genes that are expressed preferentially in both domain CA3d and CA3i (Rph3a), CA3i (Loxl1), and CA3v (Plagl1 and Coch). Numbers 1–4 indicate corresponding anatomic locations in E. These gene expression digital images were downloaded from the ABA

