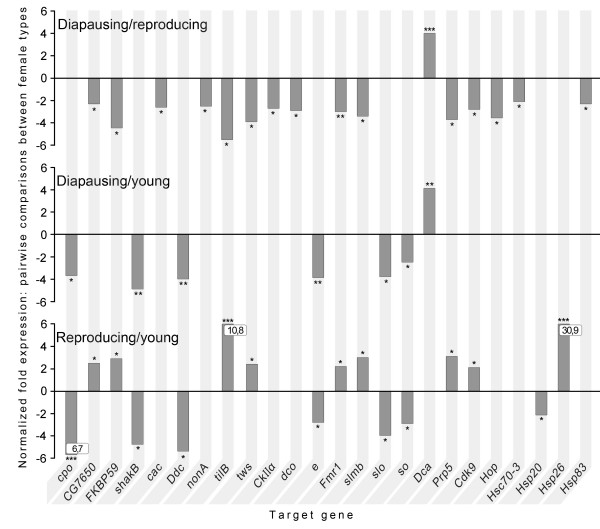
Figure 1.
Normalized fold expression of the candidate genes in microarray analysis. Normalized fold expression of the candidate genes in diapausing females compared to reproducing females, in diapausing females compared to young females and in reproducing females compared to young females in microarray analysis. Up-regulation is shown with the positive values and down-regulation with the negative values on y-axis. Significance levels: *0.05 > P > 0.01, **0.01 > P > 0.001, ***P < 0.001. In cpo gene down-regulation and in tilB and Hsp26 genes up-regulation was more than 6-fold and is indicated with numbers in the boxes.

