
Figure 1.
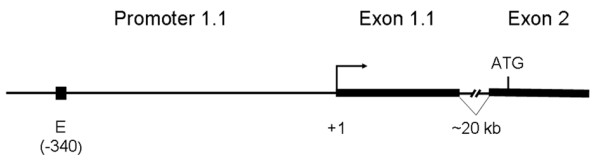
Schematic representation of the bovine placenta-specific promoter P1.1. The promoter is shown as black horizontal line with the E-box (-340) shown as a black box. The transcription start site is marked by +1 and an arrow. Exons 1.1 and 2 are drawn as thick black lines, the ~20 kb intron between them is indicated. The translation start site within exon 2 is marked by the ATG codon.