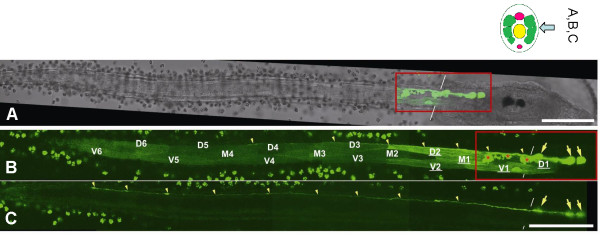
Figure 5.
(A-C) Expression of enhanced GFP under the control of a 2.5 kb 5'-flanking sequence of the Ci-GlyR gene containing a putative Ci-GlyR promoter. (A) A brightfield image partially merged with the GFP expression pattern (red rectangle that corresponds with the view in C). (C, D) The two image planes on right (C) and left (D) muscle bands from a typical sample that shows GFP expression in muscle cells and motoneurons (large yellow arrows). Some nerve terminals are branched (red asterisks), while others have long axons that enter the tail nerve cord (small yellow arrowheads not resolvable easily in I). Ciona muscle bands are composed of three rows of cells, dorsal (D), middle (M), and ventral (V), and are numbered from anterior to posterior. Muscle cells with the highest expression in this specimen are underlined. The background signal in the tunic cells on the surface of the larva is due to autofluorescence that is also present in the controls. Scale bar = 100 μm.

