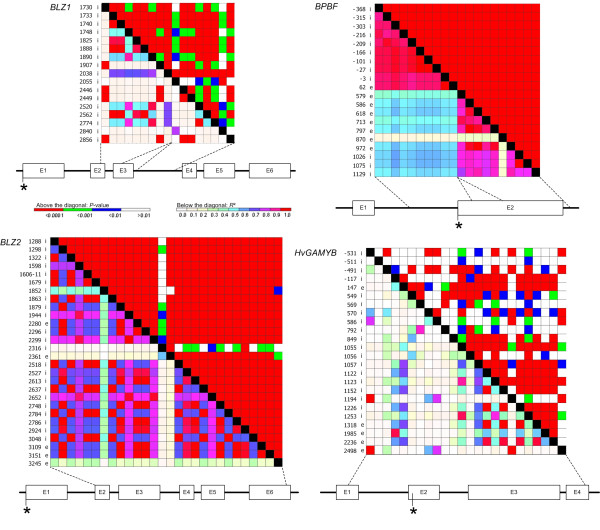
Figure 2.
Linkage disequilibrium between the polymorphic sites (MAF>0.05) within the candidate loci BLZ1, BLZ2, BPBF, HvGAMYB. Asterisk indicates transcription start, dashed lines indicate regions that were sequenced and "i" and "e" column indicates polymorphisms in introns and exons, respectively. MAF = minor allele frequency.

