
Figure 3.
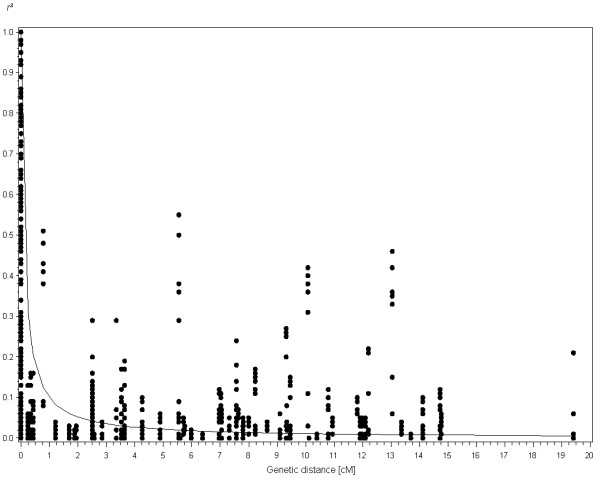
LD decay plot in the surrounding regions of the four candidate genes as a function of genetic distance (in cM). Dots indicate pairwise comparisons between SNP alleles with minor allele frequency larger 0.05. The curve shows nonlinear regression of r2 on genetic distance.