Figure 2.

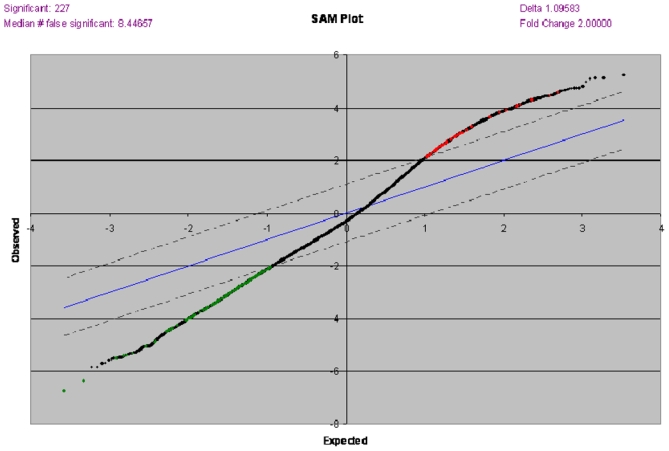
SAM plot with transcripts significantly up-regulated (N=67, red dots), and down-regulated (N=160, green dots) in 14 patients with < 60 ml prostate glands versus 20 patients with > 60 ml prostate glands.

SAM plot with transcripts significantly up-regulated (N=67, red dots), and down-regulated (N=160, green dots) in 14 patients with < 60 ml prostate glands versus 20 patients with > 60 ml prostate glands.