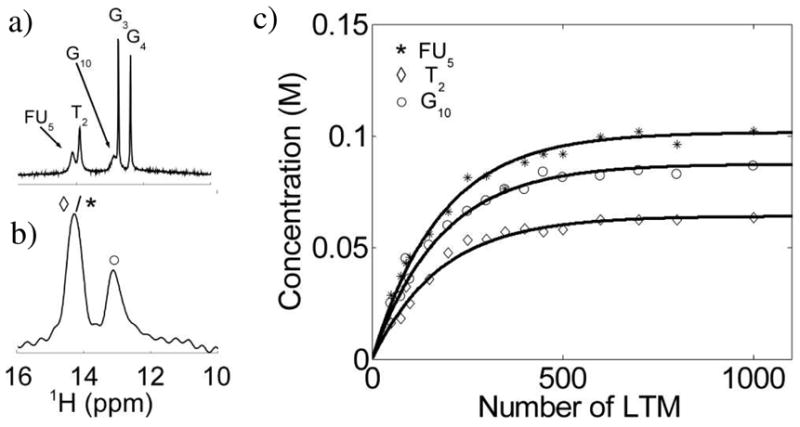
Figure 3.

Quantitative validation of the FLEX method for the DNA duplex 5′-C1T2G3G4FU5A6C7C8A9G10-3′ (T = 10 °C, pH = 9.0). (a) JR spectrum in which all imino protons are observable. (b) FLEX spectra in which G3 and G4 do not appear. (c) Concentration of labeled protons generated by FLEX as a function of the number of applied LTM’s. Data based on time domain fitting, where FU5 and T2 could be deconvoluted using prior knowledge of the chemical shift and decay rate,. Black lines are best fits of the data to Eq. 2 (concentration = PTRs * [H]w,).
