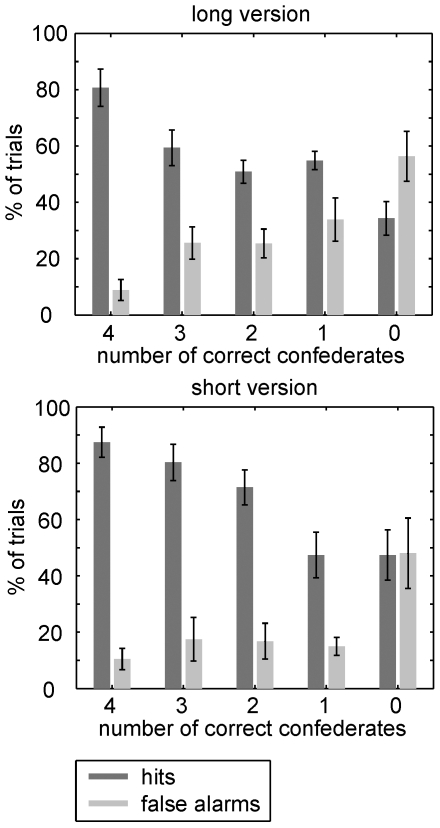
Figure 2. Conformity effects on memory.
Dark gray bars indicate percentage of hits (i.e., correct responses during presentation of old items), light bars percentage of false alarms (i.e., incorrect responses during presentation of new items). Bars are normalized to the total number of items presented in each group response condition, separately for old and new items. Memory was significantly better than chance and was affected by group opinion (“memory”דgroup” interaction), indicating a highly significant effect of conformity. This effect was similar for the long and short version of the experiment. Error bars indicate s.e.m.

