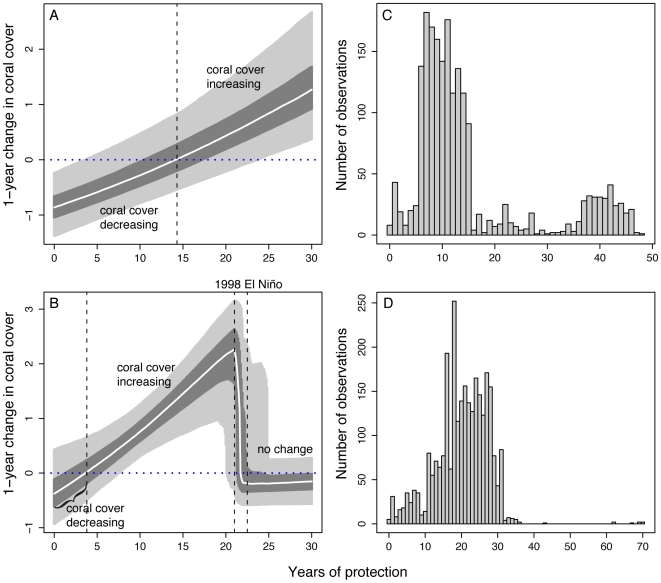
Figure 4. The effect of the number of years of protection on the 1-year change in coral cover and number of observation.
Coral cover change rates are shown in the (A) Caribbean and (B) Indo-Pacific with the 95% credibility intervals (light grey bands) and the 50% credibility intervals (dark grey bands) as well as the median (white line) of the posterior distributions of the year of protection models using all years of data and 2005 coral cover change rates. The number of years of protection by observations (surveys) in the (C) Caribbean and (D) Indo-Pacific show that most surveys have been performed when MPAs have been established for 15 years or less.

